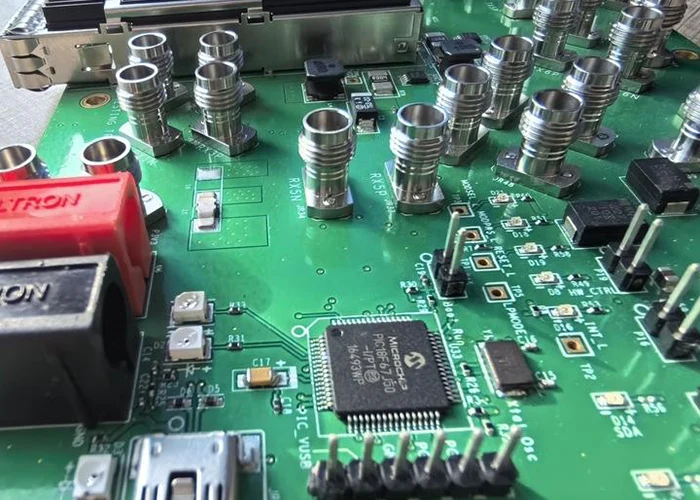
The integrated electronic surface-mount production line at the Northwest Institute of Mechanical and Electrical Engineering is responsible for the initial surface-mount production of a certain type of PCB.
Since this PCB is used in pyrotechnic devices and is produced in large quantities, the planned production workload is heavy, with over 5.6 million components to be mounted.
Based on the actual production conditions of the surface mount production line, during the trial production process, the production load time per shift was 450 minutes.
Statistics were compiled for six shifts, downtime was 125, 99, 99, 90, 130.5, and 112.5 minutes, respectively.
The average capacity utilization rate was calculated to be 75.3%, indicating a relatively low utilization rate.
In order to complete the production of a certain type of PCB more quickly and efficiently, and to ensure on-time delivery to the military, it is essential to improve the capacity utilization rate of the surface mount line.
Analysis of Capacity Utilization on an Automated Production Line
Process engineers and operators compiled statistics on the production status of six batches on the surface-mount assembly line.
During a single shift, the equipment was in operation for 450 minutes, with downtime totaling 111 minutes.
A statistical analysis was conducted to identify the factors contributing to equipment downtime (see Table 1)..
| No. | Downtime Factor | Downtime / min | Cumulative Downtime / min | Percentage / % | Cumulative Percentage / % |
|---|---|---|---|---|---|
| 1 | Printer Jig Misplacement | 39 | 39 | 35.2 | 35.2 |
| 2 | Pick-and-Place Machine Feeder Replenishment | 28 | 67 | 25.2 | 60.4 |
| 3 | Pick-and-Place Machine Material Handling | 23 | 90 | 20.7 | 81.1 |
| 4 | Carrier Tape Abnormality Handling | 9 | 99 | 8.1 | 89.2 |
| 5 | Board Ejector Abnormality | 5 | 104 | 4.5 | 93.7 |
| 6 | Other Factors | 7 | 111 | 6.4 | 100 |
Table 1. Analysis of Equipment Downtime Factors
Statistics show that the time spent setting up printing machine fixtures accounts for 35.2%, while downtime for refilling components on the placement machine accounts for 25.2%, and 20.7% was spent on handling rejected components from the placement machine.
These three factors account for 81.1% of total downtime and are the primary causes of low production capacity utilization in the surface-mount assembly of a certain type of circuit board.
Process Optimization for Automated Production Lines
Reasonable processes and operational procedures, scientifically determined assembly parameters, and appropriately configured process equipment form the foundation for smooth production.
To improve capacity utilization, these processes are optimized.
Modify the Reel Loading Method to Eliminate Downtime for Reel Loading
To address the issue of inappropriate reel loading methods, the reels at the loading station are divided into three zones: the “Full Reel Zone,” the “Half-Full Reel Zone,” and the “Reels to Be Completed Zone.”
Reels nearing completion are spliced and placed in the Full Reel Zone, and the loading zones are adjusted promptly.
To address the varying characteristics of carrier tapes, suitable and reliable spooling methods were developed.
An inventory of materials revealed three distinct types of carrier tapes; their spooling methods and operating procedures are detailed in Tables 2 and 3.
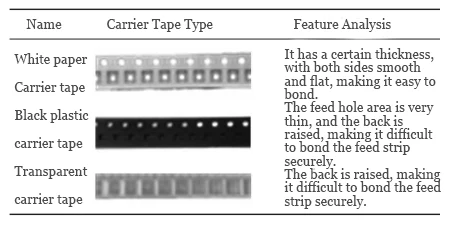
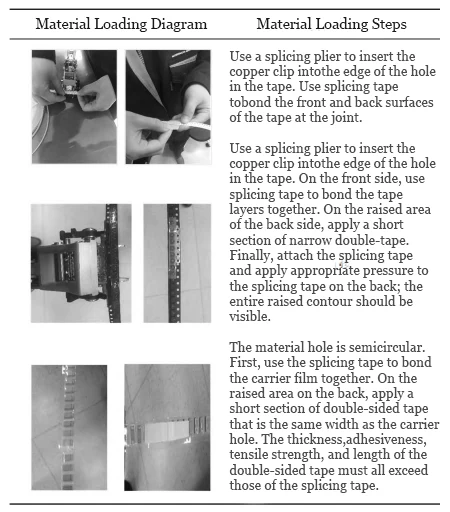
Through practical application, operators can promptly detect when material is running low, thereby completely eliminating the need for production stoppages to replenish supplies and eliminating the step of checking the feeder.
This has completely resolved the issue of production stoppages for material replenishment during production.
Optimizing Process Parameters to Reduce Rejection Time
Irregular edges and inconsistent heights of surface-mount capacitors affect the pickup process.
The traditional “corner analysis method” for pickup causes components to exceed the allowable tolerance range, leading to rejection.
Analysis showed that selecting the “component correction analysis method” effectively reduces the instability in center calculation caused by irregular edges.
Furthermore, because the SMT equipment uses a No. 4 nozzle, the capacitors’ insufficient flatness combined with the large nozzle opening caused vacuum leaks during pickup.
Replacing the nozzle with a smaller No. 3 nozzle resolved the issue of rejects caused by vacuum leaks.
Placement Parameter Optimization
The settings of placement parameters have a significant impact on the rejection phenomenon.
This paper employs visual inspection, orthogonal experiments, and range analysis to select the optimal combination of placement parameters (see Tables 4 and 5).
| Verification Parameter Name | Adjustable Range of Experimental Data |
|---|---|
| A: Z-Axis Vertical Speed | 1–3 mm/s |
| B: Window Size for Mounting | 1–3 mm |
| C: Rotation Speed of Suction Nozzle | 1–3 mm/s |
Table 4. Parameter Range Setting Table
| Test No. | A: Z-Axis Vertical Speed / mm·s⁻¹ | B: Mounting Window Size / mm | C: Nozzle Rotation Speed / mm·s⁻¹ | Material Throwing Rate / % | Qualification Rate / % |
|---|---|---|---|---|---|
| 1 | A1 (1) | B1 (1) | C1 (1) | 4.20 | 95.80 |
| 2 | A1 (1) | B2 (2) | C2 (2) | 3.50 | 96.50 |
| 3 | A1 (1) | B3 (3) | C3 (3) | 3.00 | 97.00 |
| 4 | A2 (2) | B1 (1) | C2 (2) | 1.60 | 98.40 |
| 5 | A2 (2) | B2 (2) | C3 (3) | 0.32 | 99.68 |
| 6 | A2 (2) | B3 (3) | C1 (1) | 1.60 | 98.40 |
| 7 | A3 (3) | B1 (1) | C3 (3) | 1.30 | 98.70 |
| 8 | A3 (3) | B2 (2) | C1 (1) | 1.90 | 98.10 |
| 9 | A3 (3) | B3 (3) | C2 (2) | 0.70 | 99.30 |
Table 5. Orthogonal Method L9
Orthogonal Experiment and Range Analysis
A visual inspection reveals that Test No. 5 had the lowest scrap rate, with a value of 0.32%, which was the best result among the nine tests.
Therefore, A2B2C3 is the optimal combination of factors. The test results were analyzed and verified using range analysis (see Figure 1).
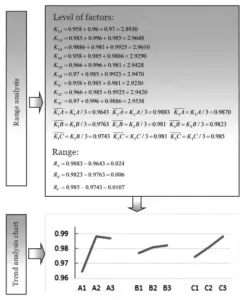
The results indicate that A2B3C3 is the optimal condition. However, for the primary factors, the levels yielding the best performance metrics should be selected—that is, A2 for A and C3 for C.
For the secondary factors, production efficiency must also be considered, so B2 and B3 can be selected.
Validation of Optimal Process Parameters
The team conducted validation tests using both A2B2C3 and A2B3C3, and Table 6 presents the results.
The results show that the scrap rates remain consistent. To ensure production efficiency, the team selected A2B2C3 as the optimal production condition.
Therefore, the engineers set the Z-axis vertical speed, placement window size, and nozzle clamp rotation speed to 2 mm/s, 2 mm, and 3 mm/s, respectively.
| Test No. | Test Condition | Scrap Rate / % |
|---|---|---|
| 1 | A2B2C3 | 0.32 |
| 2 | A2B3C3 | 0.32 |
Table 6. Statistics on Scrap Material
Fabricate Custom Fixtures to Reduce the Risk of Breakage
Due to the large size of the PCB panel, the overall rigidity of the panel is reduced.
When placed on the SMT production line conveyor, the panel may deform, leading to issues such as component drop-off, uneven heating, PCB warping, or even breakage during the placement process, which compromises production safety.
Taking into account the characteristics of panelization, thin boards, and double-sided soldering, the design incorporates specific jigs for this application.
Figure 2 shows a schematic diagram of the PCB panel spacing and jig thickness.
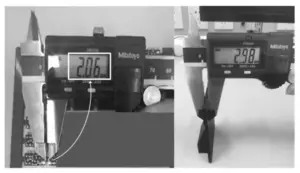
After mechanical engineers analyzed the placement process and key considerations, they collaborated with operators to design the drawings (see Figure 3) and carry out the fabrication.
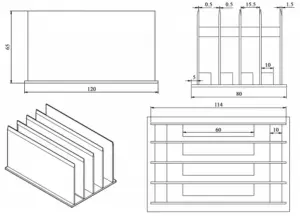
To meet the positioning and thermal requirements for PCB panelization, phenolic laminate was selected as the material for the jig. The finished product is shown in Figure 4.
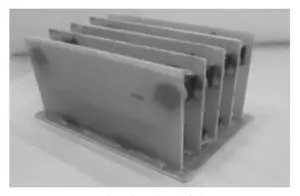
The jig consists of five support phenolic boards, a base, long iron blocks, and positioning blocks.
The five support phenolic boards have a thickness of 1.5 mm, which is 3.0 mm less than the process edge.
The top edges on all five sides use a tapered design to provide greater flexibility for accommodating variations in PCB dimensions.
The base plate is 2 mm thick.
Long iron bars secure each support plate to the base plate to ensure vertical alignment.
Positioning blocks are sequentially added on top of the support plates to ensure precise dimensions and prevent deformation between the support plates and the base plate.
This fixture effectively enhances the overall rigidity of the PCB panel, prevents component drop-outs and panel fractures, and ensures high-quality placement and soldering.
Verification of the Optimization Plan
After strictly adhering to the no-downtime feeding method for material feeding, and using the optimized parameters and specialized fixtures, we compiled statistics on production downtime (see Table 7).
| No. | Downtime Cause | Downtime Duration (min) | Cumulative Downtime (min) | Percentage (%) | Cumulative Percentage (%) |
|---|---|---|---|---|---|
| 1 | Conveyor Belt Abnormality Handling | 14 | 14 | 33.3 | 33.3 |
| 2 | Feeder Abnormality | 9 | 23 | 21.4 | 54.7 |
| 3 | Placement Machine Material Throwing Handling | 5 | 28 | 11.9 | 66.6 |
| 4 | Placement Machine Fixture Placement | 2 | 30 | 4.8 | 71.4 |
| 5 | Other Factors | 12 | 42 | 28.6 | 100 |
Table 7. Statistics on Downtime After Optimization
Statistics on the capacity utilization rate of surface-mount production lines (see Table 8).
| No. | Load Time (min) | Downtime (min) | Capacity Utilization (%) |
|---|---|---|---|
| 1 | 450 | 27 | 94 |
| 2 | 450 | 45 | 90 |
| 3 | 450 | 49.5 | 89 |
| 4 | 450 | 27 | 94 |
| 5 | 450 | 31.5 | 93 |
| Average Value | 92 |
Table 8. Capacity Utilization Statistics
With the implementation of new processes, new process parameters, and new tooling, this shift achieved an average production line utilization rate of 92% for a specific type of PCB surface-mount assembly line within a 450-minute load time.
Economic Benefits
According to calculations, the production line optimized through process improvements has yielded savings of approximately 140,000 yuan.
The calculation determines the improvement input-output ratio as follows: Improvement Quantified Benefits / ∑ Improvement Investment Costs = (140,400 + 1,254) / (483 + 500) ≈ 144.1. Table 9 details the specific savings.
| No. | Expense Item | Economic Value (CNY) | Calculation Process |
|---|---|---|---|
| 1 | Material Cost Expenditure | 483 | ① Tooling material cost: 63 CNY ② Tooling fabrication labor time: 14 h; hourly wage: 30 CNY/h; tooling fabrication labor cost: 14 × 30 = 420 CNY Total expenditure: 63 + 420 + 15 = 483 CNY |
| 2 | Tooling Cost | 500 | Total cost for jig materials and machine setup: 500 CNY |
| 3 | Saved Material Cost | 1,254 | As the scrap rate decreased, the saved material cost reached 1,254 CNY |
| 4 | Saved Production Capacity Cost | 140,400 | Based on a planned production volume of 510,000 circuit boards, the economic value saved was calculated. As the utilization rate of the integrated electronic mounting equipment increased, the production cycle for 510,000 units shortened by 1,170 h. The integrated electronic mounting equipment required 4 operators, with an hourly wage of 30 CNY/h. Saved cost: 1,170 × 4 × 30 = 140,400 CNY |
| Total | Total Economic Value | Approximately 140,000 CNY | 140,400 − 483 − 500 + 1,254 = 140,671 CNY |
Table 9. Economic Value Calculation Table
This type of PCB is a core component of a certain system. Shortening its surface-mount production cycle has effectively ensured our institute’s ability to fulfill contracts for the weapons and equipment we produce, increased satisfaction among final assembly plants and the military, and provided
a solid foundation for the institute’s development.
Consolidation and Improvement
After operators review and approve the techniques for connecting different carrier tapes, the unit incorporates them into the “Compilation of Electrical Assembly Technical Skills” to consolidate and optimize the results.
Additionally, testing verifies the parameters, and the SMT machine programs embed these parameters. The process documentation then includes the programs to ensure production strictly follows the established procedures.
At the same time, we will establish standardized calibration procedures for specialized jigs and fixtures, perform regular maintenance on them, and measure their heights periodically to ensure the accuracy of the fixture dimensions.